
Summary
Content distribution ROI should be measured by connecting the full journey from campaign cost to qualified attention, enquiries, sales and retained revenue. Bolton businesses should focus on attributed revenue, cost per qualified lead, customer acquisition cost and lead-to-sale rate, using reach and impressions only as supporting indicators rather than proof of commercial return.
Key Takeaways
- Content ROI should be tracked as a full chain from cost to qualified attention to identifiable leads to sales value and retained revenue, rather than relying on reach or impressions alone
- Vanity metrics like page views and followers can help diagnose how content is performing but they cannot prove commercial return on their own
- A worked example shows how a Bolton accountancy firm turned a 2,500 pounds content investment into 7,200 pounds of attributable gross profit within 90 days
- Google Business Profile performance reporting provides a practical, low-cost way for Bolton businesses to connect local search activity to real enquiries
- West Pro Media Services Ltd recommends viewing attribution through three lenses – first touch, lead creation, and last touch – to avoid rewarding the wrong channel
Plenty of Bolton business owners can proudly point to a growing follower count or a spike in website traffic, yet still struggle to say whether their content is actually making money. That gap between activity and outcome is exactly where content ROI measurement needs to start.
Reach Isn’t Revenue
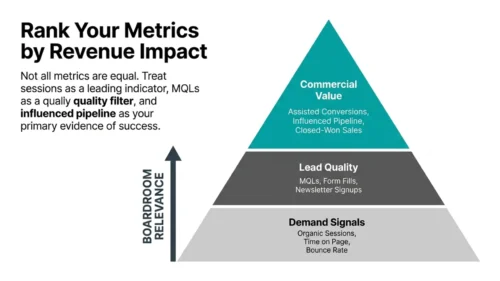
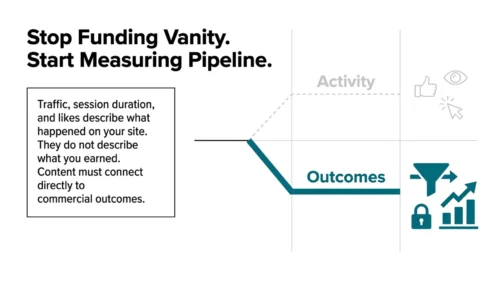
A post that reaches ten thousand people but produces no enquiries has not delivered a return, no matter how impressive the number looks on a screenshot. Reach, impressions, likes and follower counts describe how far content travelled, not whether it changed anyone’s buying behaviour. These figures are useful for spotting patterns in distribution performance, but they say nothing about pounds in the bank.
The confusion often comes from mixing up two very different jobs that metrics can do. Some numbers diagnose how well a piece of content is being seen and shared; others prove that it created identifiable commercial value. A guide for measuring content marketing mistakes in Bolton businesses covers this distinction in more depth, and it is a useful read for anyone who has ever felt uneasy reporting “engagement” to a business partner without being able to back it up with sales figures.
Genuine ROI measurement connects every stage of the process: the money spent creating and distributing a piece of content, the attention it earns from the right audience, the leads that attention turns into, and finally the sales value and retained revenue those leads generate. Skipping straight from “we posted something” to “it worked” leaves too much guesswork in the middle, and guesswork rarely convinces a bank manager, an accountant, or a business owner deciding where next year’s marketing budget should go.
Define the Outcome Content Must Drive
Before choosing any metric, it helps to be clear about what action the content is actually meant to trigger. This differs enormously depending on the type of business involved, and a one-size-fits-all dashboard usually ends up measuring the wrong thing for at least half the campaigns running through it.
A local tradesperson’s content should ideally drive a qualified phone enquiry, a survey booking, or a quote request, with useful early indicators including landing page visits and Google Business Profile actions. A professional services firm, on the other hand, is usually working for a discovery call or a signed proposal, so case study downloads and branded search growth matter more as leading signals. Retailers care about online orders and in-store visits, hospitality businesses care about bookings and covers, and training providers care about course sign-ups and renewed contracts. None of these outcomes should be measured with the same yardstick, because a dentist chasing appointments and a builder chasing site surveys are playing entirely different games.
Getting this step right early saves a huge amount of wasted reporting further down the line. Once the true commercial outcome is defined, it becomes much easier to work backwards and decide which leading indicators are worth watching day to day.
Building the ROI Measurement Chain
With the outcome defined, the next job is building a chain that links every pound spent to every pound earned. This is where most small businesses either give up too early or overcomplicate things with tools they do not need.
Counting the True Cost of Distribution
A common trap is treating organic content as free simply because no advertising budget changed hands. In reality, writing, design, photography, video production, editorial review, staff time, software subscriptions, and any paid amplification all belong on the cost side of the equation. Repurposing a single guide into social posts, an email sequence, or a short video also carries a cost, even when it feels like a quick job.
Landing page creation, agency or freelancer fees, and the staff hours spent following up on leads should be added too, since these are often the parts that quietly eat into a campaign’s real profitability. A sensible approach for evergreen “pillar” content is to spread its cost across its expected useful life rather than judging it purely on its first week of traffic, since a strong local guide might keep generating enquiries for well over a year.
Setting a Baseline Before Judging Results
ROI only means something when it is compared against what would likely have happened anyway. Comparing a campaign period against a similar period beforehand, testing one landing page against another, or holding out part of an email list are all practical ways smaller businesses can create a fair comparison without needing expensive tools.
Seasonality deserves particular attention in Bolton, where school holidays, weather-dependent trades, and local events can all distort a campaign’s apparent performance. Annotating dashboards with promotions, staff absences, or website changes helps explain unusual spikes or dips later, rather than leaving a business owner puzzling over a mystery drop in enquiries six months down the line.
Tracking the Full Customer Path
A reliable tracking setup does not need to be complicated to be effective. Defining a handful of genuine business actions, such as a completed enquiry form, a booked consultation, or a click-to-call, and marking these as key events in Google Analytics 4 gives a business a clear picture of what is actually working. Google Analytics 4 uses the term “key events” for these important actions, and its default reporting model is data-driven attribution, which spreads credit across the customer’s whole path rather than crediting a single click.
Adding UTM tags to every controllable link, from email campaigns to Google Business Profile website links, keeps the data clean enough to trust. Passing lead source information into a CRM system, and reconciling marketing data with actual sales figures every month, closes the loop between content activity and confirmed revenue.
Choosing an Attribution Model
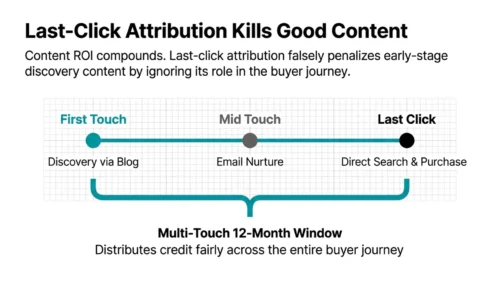
Content is frequently an assisting touchpoint rather than the final click before a sale, which means a last-click-only report can unfairly reward branded search or direct traffic while ignoring the guide or local feature that sparked interest in the first place. West Pro Media Services Ltd recommends a three-view approach to attribution: first touch to identify which activity introduces new prospects, lead creation or assisted conversion to see which content appears in journeys that produce enquiries, and last touch to understand which channel captures intent at the moment of action.
Other established attribution models exist too, including linear, position-based, and time decay approaches, each spreading credit differently across the customer’s path. None of them are perfect, but using more than one view at once stops a business from crowning the wrong channel as its star performer purely because it happened to be there last.
Local Signals That Prove Real Demand
Local visibility signals give Bolton businesses some of the most accessible evidence available for connecting content to real demand, provided they are read carefully rather than taken at face value.
Google Business Profile as an Evidence Source
Google Business Profile’s Performance reporting can show searches, website clicks, direction requests, calls, messages, and bookings over a set period, offering a genuinely useful evidence source for businesses that depend on a local service area. It is worth remembering that a “call” in this reporting simply means someone tapped the call button, not that the call was answered or led to a job, so connecting these numbers to actual call outcomes or CRM records is a necessary extra step before claiming any revenue.
Adding UTM-tagged website links to a Google Business Profile, tracking enquiries by postcode or service category, and asking new customers where they heard about the business all help turn these visibility signals into something closer to proof. Direction requests and profile views should be treated as intent signals worth investigating further, not sales already made.
Earned Local Partnerships and Community Channels
Local trade associations, chamber and business network channels, regional newspapers, and partnerships with complementary local firms often get missed by generic content marketing advice, yet they can be some of the most trusted distribution routes a Bolton business has. These relationships tend to carry a level of local credibility that a cold social media audience simply cannot match.
Measuring their impact does not need a complicated platform. QR codes with channel-specific tags, unique booking links, offer codes, and a simple spreadsheet linking a campaign code to a lead, a job, and its margin, can be more useful day to day than an elaborate attribution tool that nobody has time to interpret properly.
Metrics That Actually Matter
Once the measurement chain and local signals are in place, it helps to settle on a short list of metrics that genuinely tell a business owner something useful about performance, rather than a long list that looks impressive but leads nowhere.
- Attributed revenue and attributed gross profit, showing the actual financial return once cost is factored in.
- Cost per lead and cost per qualified lead, revealing how efficiently each channel is generating genuine interest.
- Customer acquisition cost, which shows the real price of winning a new customer once marketing and sales time are combined.
- Lead-to-sale rate, calculated as new customers divided by qualified leads and multiplied by one hundred, showing how well leads convert once they reach the sales process.
- Return on ad spend, useful specifically for any paid distribution activity sitting alongside organic content.
Diagnostic numbers such as engaged sessions, returning visitors, and organic search growth still have a place, since they help explain why a channel is or is not converting well. The key is keeping these separate from the financial metrics above, so a healthy-looking engagement report never gets mistaken for proof of profit.
A Worked Example: Turning £2,500 into £7,200 Gross Profit
A hypothetical Bolton accountancy firm provides a clear illustration of how this all fits together in practice. The firm invests £1,500 in producing a payroll-compliance guide, including design and specialist review, £600 in LinkedIn distribution and an email sponsorship, and £400 of staff time managing the campaign and following up leads, bringing total investment to £2,500.
Over a 90-day tracking window, the guide is linked to 24 enquiries, 12 qualified discovery calls, and 4 new retained clients, generating £12,000 in first-year attributable revenue. With a 60% gross margin, that translates into £7,200 of attributable gross profit. Subtracting the £2,500 investment and dividing by that same figure gives an ROI of 188%, meaning every pound invested returned £2.88 in gross profit once the original pound is included.
The real value of this example lies in what it teaches beyond the headline number. If LinkedIn drove most of the initial visits but email follow-up produced most of the booked calls, both channels deserve credit rather than crediting whichever one happened to close the deal. If the guide attracted plenty of downloads but few qualified calls, the fix likely lies in the offer, the landing page, or the follow-up process, rather than scrapping the topic altogether.
Mistakes That Distort ROI Reporting
Even a well-built measurement chain can be undone by a handful of common mistakes, several of which are easy to fall into without realising the damage they are doing to reported figures.
Last-Click-Only Measurement
Crediting only the final click before a sale systematically punishes the educational content that started the customer’s path in the first place. A prospect might read a helpful guide, later find the business through a Google search, and only enquire after receiving a follow-up email, yet a last-click report would hand all the credit to that final email. Using first-touch, assisted, and last-touch views together, as outlined earlier, gives a far fairer picture of which content is actually doing the heavy lifting.
Ignoring Offline Conversions
Plenty of valuable local conversions still happen by phone call, walk-in visit, or word-of-mouth recommendation, none of which show up automatically in a website analytics dashboard. A CRM process, a simple “how did you hear about us” question, and consistent outcome tracking are the fixes here, and phone call tracking services can be integrated with Google Business Profile to give more accurate data on how many calls actually turned into booked appointments. Leaving these offline conversions out of the picture almost always makes content look far less effective than it really is.
Content ROI Demands Full-Path Proof, Not Vanity Metrics
Bringing all of this together, the real test of content ROI is whether it can be traced through to a genuine sale, a retained customer, or repeat business, rather than how far a post travelled. Reach and impressions still have their place as diagnostic signals, but they were never designed to answer the question every business owner actually cares about: did this content make the business money?
Building a proper measurement chain, from fully loaded cost through to sales value and retained revenue, takes a bit more discipline than glancing at a follower count, but it pays off every time a marketing budget needs justifying. For Bolton businesses ready to put these ideas into practice without getting lost in spreadsheets, starting with a clear content marketing strategy built around measurable outcomes is a solid next step.
| Topic / Area | Key Finding | Business Impact | Why It Matters |
|---|---|---|---|
| ROI attribution challenge | 56% struggle to attribute content ROI | Revenue reporting remains uncertain | Track content through lead, sale and retained revenue |
| Customer journey tracking | 56% find journeys difficult to track | Last-click reports can misallocate budget | Use first-touch, assisted and last-touch reporting |
| Meaningful conversion events | GA4 supports business-defined key events | Measures enquiries, bookings and qualified actions | Replace traffic-only reporting with genuine commercial outcomes |
| Local-intent measurement | Profile clicks and calls indicate demand, not sales | Helps prioritise local channels for investigation | Reconcile actions with CRM outcomes and job values |
| Privacy and consent | Cross-site tracking and advertising measurement require consent | Non-compliance can undermine data collection | Build consent, transparency and opt-out into tracking plans |
Sources
Content Marketing Institute — B2B Content Marketing Benchmarks & Trends 2025
Information Commissioner’s Office — Storage and Access Technologies Guidance
Frequently asked Questions
How long should a Bolton business wait before judging content ROI?
Most local service businesses should use at least a 90-day window, particularly where customers research before requesting a quote or booking a consultation. For higher-value services, track influenced leads and future pipeline as well as completed sales, then revisit results over six to twelve months.
What is a good content ROI percentage for a small business?
There is no universal benchmark because margins, sales cycles, and customer lifetime value differ widely. A positive ROI means content has generated more attributable gross profit than its fully loaded cost. Compare performance against your own previous campaigns and alternative lead-generation channels rather than a generic industry figure.
How can we track enquiries that happen by phone or WhatsApp?
Use a distinct tracked phone number or call-tracking software, create dedicated WhatsApp links for each campaign, and record outcomes in a CRM or lead spreadsheet. Ask every caller how they found you, then connect each enquiry to whether it became a quote, sale, or repeat customer.
Should Google Business Profile clicks count as content ROI?
Not on their own. Website clicks, calls, direction requests, and booking actions from your Google Business Profile show local intent, but they do not prove revenue. Treat them as leading indicators, then match them with accepted jobs, sales values, and gross profit before calculating ROI.
What should we do if content receives traffic but produces few qualified leads?
Check whether the content reaches the right audience, answers a purchase-related question, and leads to a relevant next step. Improve the call to action, landing page, offer, or follow-up process before abandoning the topic. Strong traffic with weak conversion often signals a journey problem, not necessarily poor content.